Wednesday, September 30, 2020

NQ Guideline For Thursday

On Wednesday NQ opened above 20-ma on the 5-minute chart, and then quickly rallied triggering massive short-covering activities rocketing NQ up to key resistance zone between 11,480-11,550 zone, before selling came back in to sell.

The pattern is clearly a distribution pattern, as such we should continue to see wild swings until distribution is complete and then selling overwhelm buying completely.

On Thursday 11,340 will be key line-in-the-sand for NQ. Above 11,340 we could see NQ rallying back up to test the 11,480-11,550 resistance zone.

Below 11,340 we could see NQ dropping down to support at 11,150-11,200

Tuesday, September 29, 2020

NQ Guideline For Wednesday

Following a huge rally day on Friday that continued into Monday, NQ traded in a very choppy narrow trading range on Tuesday, setting up a potential large trending day on Wednesday especially if the trend direction is up.

Key support for NQ on Wednesday will be at 200-ma on the 5-minute chart. If NQ happens to trade below 200-ma on the 5-min chart we could see a quick decline to support between 11,150-11,200. As long as 11,050 is not clearly violated it should bounce and rally back up from it.

Key resistance on Wednesday will be at 11,340. Trading above 11,340 could start to trigger short-covering rally, with first potential resistance at 11,500.

Monday, September 28, 2020

NQ Guideline For Tuesday

On Monday, with the hope of imminent 2.2 trillion dollars unsanitized money printing the market gapped open higher, but  has to consolidate before running back up, now on wave 5 rally leg from September 24 low.

NQ can continue higher as long as it stays above 50-ma on the 5-minute chart. Breaking below 50-ma on the 5-minute chart implies end of current wave 5 upleg, and a return to choppy sideways price action, with downside target at 200-ma on the 5-inute chart.

Key line-in-the-sand for Tuesday will be ayt 11,340.


Sunday, September 27, 2020

NQ Guideline For Monday


A massive short-cover rally on Friday, whatever the cause may be, pushed NQ back up into key resistance on the daily chart, the 50-day moving average, a critical level going forward, to break or not to break 

A sustained break above has the potential to cause more short-covering rally, and of course, failure to break would cause a massive sell-off again, back to test the recent low.

On the 5-min chart, at the end of the day on Friday NQ was in overbought on the 5-min timeframe, and may pullback down on Monday.

If so, we could see a sideways consolidation day on Monday with key support zone between 11, 010 to 11,050.

If 11,00 or so support can hold, we should see another rally day on Tuesday.

If on the other hand, sellers came back in a massive way, we could see another liquidation day on Tuesday.

Thursday, September 24, 2020

After a big down day on Wednesday NQ spent all day trading sideways on Thursday consolidating the big sell-off day on Wednesday.

Key to trend direction on Friday will be where NQ trades in relation to its key line-in-the-sand, which for tomorrow will be the high of Thursday (11,000) and the low of Thursday (10,710)

With today's setup very similar to last week Thursday setup, we could see similar pattern, with a decline in the morning and then profit-taking rally in the afternoon.

Trading inside the zone 10,710 - 11,000 will keep NQ in a sideways pattern. .But with NQ now clearly below the 50-dma on the daily chart, we could see a free-fall if NQ should breaks below Thursday low and cannot recover.


Wednesday, September 23, 2020

NQ Guideline For Thursday

Tuesday high was at key 50-day moving average on the daily chart, a key line-in-the-sand buy/sell price level for longer-term traders. As such, with the open below 50-dma on Wednesday sellers came to sell immediately.

NQ sold off all day from open to close, and with the close near the day low, setting up a bearish day for Thursday.

Key support for NQ on Thursday will be at 10,850.

--  Below 10,850 NQ is in free-fall

-- NQ will go into a pullback consolidation mode above 10,850, with key resistance at the 200-ma on the 5-minute chart.

Tuesday, September 22, 2020

On Tuesday, after the early morning consolidation NQ trend back up making a higher high above morning high in the afternoon, spotting a 5-wave rally from Monday swing low. At the end of the day, NQ was still in wave 5.

For Tomorrow, a break below 50-ma on the 5-minute chart is an indication that wave 5-rally has ended, and that NQ is going into a consolidation or a reversal. A consolidation or a reversal implies a decline towards the 200-ma on the 5-inute chart.

NQ high of the day on Tuesday was at key 50-ma on the daily chart, a critical level going into Wednesday, a line in the sand resistance going forward.


Monday, September 21, 2020

NQ Guideline For Tuesday

After dropping down to lower low below Friday low soon after the open on Monday NQ reversed and rallied the rest of the day on Monday.

With NQ breaking and closing above key resistance 10,850, now support going into Tuesday trading, it sets up a bullish tone for Tuesday.

With NQ in overbought zone on the 5-minute chart at the close, I would be looking for a pullback in the morning on Tuesday before it rally again, that is as long at it does not break below key support, 10,850.

Breaking below 10,850 is bearish, and it is expected to decline again, target is a break below Monday low.

Sunday, September 20, 2020

NQ Guideline For Monday

On Friday NQ trend down to lower low below Thursday swing low, still confirming that NQ is in a downtrend on the daily chart. Going into Monday NQ should continue its downtrend on the daily chart as long as the rally remains below Friday swing high..
 
Key inflection price level for NQ on Monday will be at 10,950, a key support price level.
-- If NQ should open above 10,950 on Monday and then stays above 10,950, we should see NQ rally up to 200-ma resistance, which should be a strong resistance on Monday, a level where sellers would copme back to go short.
-- Should NQ open below 10,950 on Monday or open above 10,950 but then drop down to below 10,950 on Monday we should see another selling day that should break below Friday low. If so, it should tank down hard.

Thursday, September 17, 2020

NQ Guideline For Friday

A big gap-down for NQ on Thursday with afternoon reversal.

The reversal should continue up to the 200-ma resistance on Friday, as long as the open is abovve 11,050, line-in-the-sand on Friday.

With Fridat tending to be a sideways pattern, I am looking for NQ to trade between Thursday low at 200-ma resistance on the 5-minute chart.

Shoud NQ trade below Thursday low, we could see a real crash.


Wednesday, September 16, 2020

NQ Guideline For Thursday

Post FOMC policy announcement on Wednesday the market tank. NQ is now over 150 points below Wednesday close. Should NQ open and stay below Wednesday day low we could see massive liquidation, a 400 - 500 points drop because the next strong support is not until10,300.
 
Again, key support for NQ on Thursday is 11,150, bearish below, bullish above it.
 
Key inflection price zone for NQ on Thus day will be at 11,320

Tuesday, September 15, 2020

NQ Guideline For Wednesday

NQ traded sideways on Tuesday ahead of the FOMC decision on Wednesday. NQ may continue to trade sideways until the release of the FOMC minutes in the afternoon.

Key to the direction of the trend will be what happen after the FOMC announcement.
--If NQ remains above 200-ma on the 5-min chart, we should see NQ continue to rally higher retracing the big drop during the first week of September, first resistance is the 20-ma on the daily chart, around 11,650..
-- If NQ should drop below the 200-ma on the 5-minute chart after the FOMC decision on Wednesday that would imply the beginning of the next leg down. If so first support is around 11,000-11,100

Monday, September 14, 2020

NQ Guideline For Tuesday ( September Contract)

On Monday  NQ opened with a huge gap-up which triggered short-covering causing it to break above 200-ma resistance on the 5-min chart. It then consolidate d sideways above the 200-ma all day on Monday,
 
On Tuesday as long as NQ remains above 200-ma we could see a rally. Rally target is 11,400 - 11,575 double-top.
 
If on the other hand NQ fall back below 200-ma, it is a sign of bearishness, with first support at 11,100. Trading below 11,100 is very bearish.

Sunday, September 13, 2020

NQ Guideline For Monday - price level is based on September futures contract

As usual, NQ traded sideways on Friday, with  choppy sideways morning that was followed by midday selling that was then followed by afternoon rally, with a close right near key support level of 11,050 on NQ September Futures Contract which again will serve as key support level for trading on Monday.
 
With the futures contract already trading up over 150 points on Sunday evening, it is possible that trailing stop-losses for the short sellers could get run-over when the stock market opens for trading on Monday, triggering a rally up to the next key resistance, the 5-minute 200-period moving average, not at 11,275, at similar level to Fridays swing high.
 
11,275 will serve as very strong resistance for any rally on Monday, As such if they are able to push NQ above 11,275 on Monday, it could trigger further rally and failure to break above it cold send NQ back down to 11,050

Thursday, September 10, 2020

NQ Guideline For Friday

On Thursday, NQ opened with a gap-up above prior day range, then reversed and trend down,  trapping many buyers who then has to exit at the end of the day with a big loss as we can see NQ tanked in the afternoon as buyers bailed out of their long position.
 
NQ usually trade sideways on Friday with key resistance at 200-ma (11,330) on the 5-min chart and key support at 11,050.
 
As long as NQ remains inside the 11,050-11,330, it would be a sideways day. Only a sustained break out of the range could cause a trending move in the direction of the break.

Wednesday, September 9, 2020

NQ Guideline For Thursday

Another consolidation day for NQ on Wednesday following two very large down day that drop NQ down to vary strong support on the daily chart,11,050
 
On Thursday, as long as NQ remains above Wednesday low we should continue to see short-covering rally in a choppy sideways trading pattern.
 
Key line-in-the-sand for NQ on Thursday will be at 11,300
-- NQ is bullish above it, with first upside target at 11,550
-- Bearish below it with support at 11,150 - 11,200 
 
NQ needs to break below 11,050 strong support zone and where trailing stop-losses now congregates, to cause massive selling that can tank NQ over 1,000 points in one day.

Tuesday, September 8, 2020

NQ Guideline For Wednesday

On Tuesday NQ traded sideways but after a sharp morning rally, trend down and closed at the low of the day at key support price level, the 50-day moving average and previous swing high now support, at 11,050.
 
11,050 is a very important support, key line-in-the-sand going forward.
-- A break below is likely to trigger an avalanche of selling as the longs get liquidated, next support are 10,300 and 8900 - 9700 zone.
-- If NQ can stay above 11,050, we could see a relief rally but needs to break above 11,200 to trigger some short-covering.

Monday, September 7, 2020

NQ Guideline For Tuesday

Another very large selling on Friday morning with NQ trading down to within 50 points above very strong support at the provided by the daily 50-day moving average and the July consolidation high at 11,050.
 
It is a major battle between several major market players, between those that wants the market to melt up and those that wants the market to go down.
 
The stake is very high, with 11,050 acting as key line-in-the-sand.
-- A break below 11,050 in a very convincing and with a daily close below 11,050, is very likely to trigger an avalanche of sell orders capable of cause a major crash because there is NO meaningful support until 9.700 the February 2020 swing high. Considering how many novice traders currently participating in the market, we could see NQ dropping down to 9,700 in 1 to 2 days, triggering a massive panic.
-- On the other hand, if 11,050 can hold the current selling frenzies, we could see NQ going back up to retest the recent high, No matter what happens in the short term, the top is likely already been made, and NQ should starts to trend down starting very soon, if not has already started.
 
On the short-tern intraday timeframe, key line-in-the-sand for NQ on Tuesday will be at 11,520.
-- Bullish above it with resistance at 11,800
-- Bearish below it with first support at 11,350

Thursday, September 3, 2020

NQ Guideline For Friday

NQ opened with a gap-down then traded down below prior day low where trailing stop-losses congregates, running over stop-losses, and crash hard, down over 700 points from prior day close.
 
Unless the Fed can push the market overnight ahead of the employment report to be released before the market open in the morning, NQ is set to tank hard at soon after the open if margin-selling materializes.
 
Key price level to watch tomorrow will be 11,850, then the pivot at 11,900 as possible resistances for the profit-taking rally ahead of the long weekend.
 
Below Pivot, we either get heavy selling, a crash, or just the normal Friday pattern, the sideways pattern.

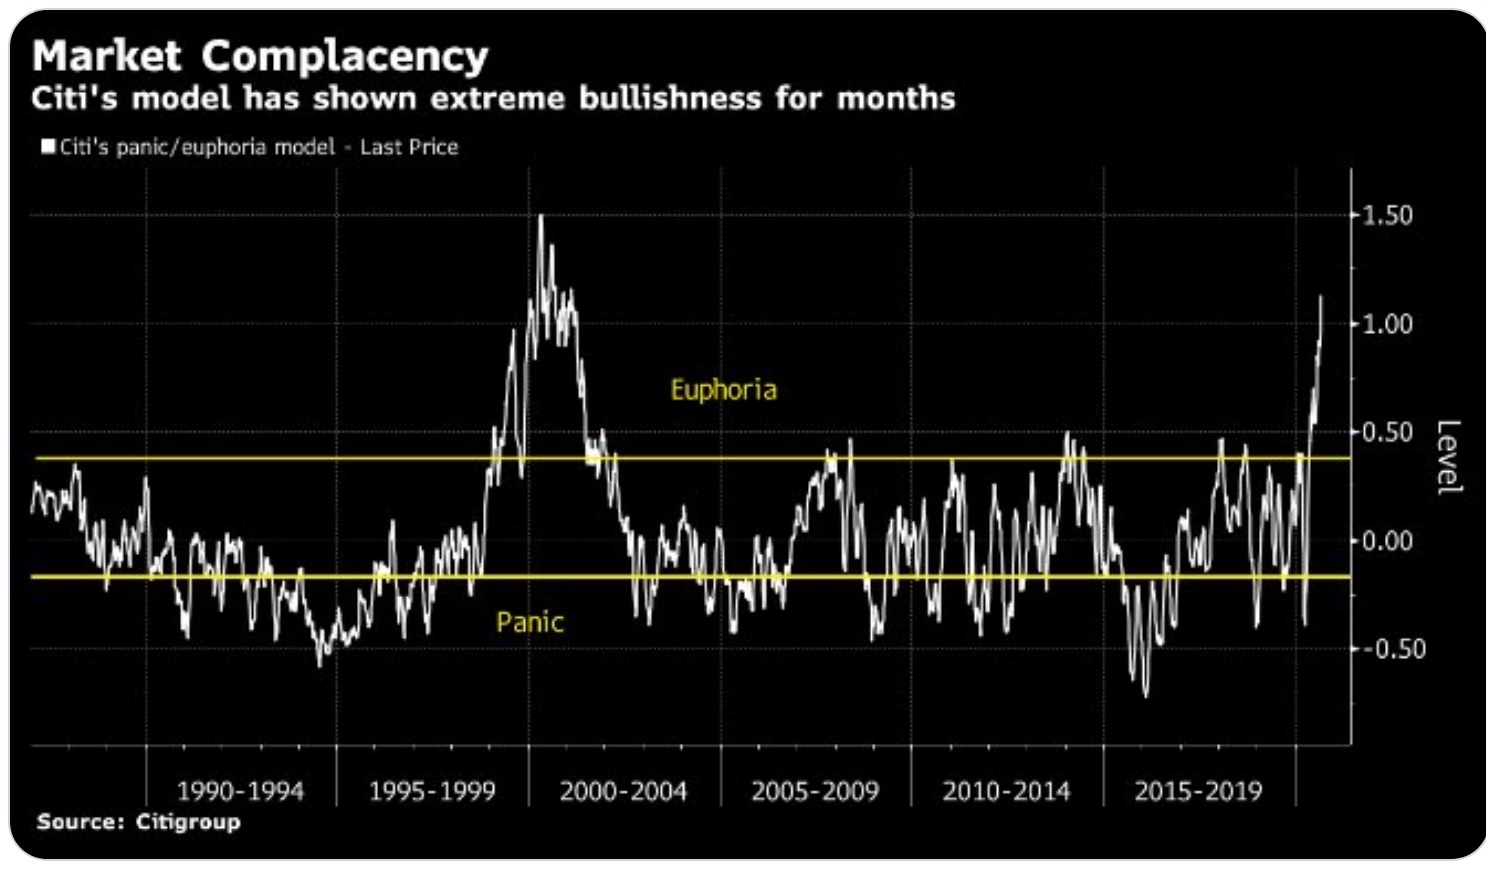
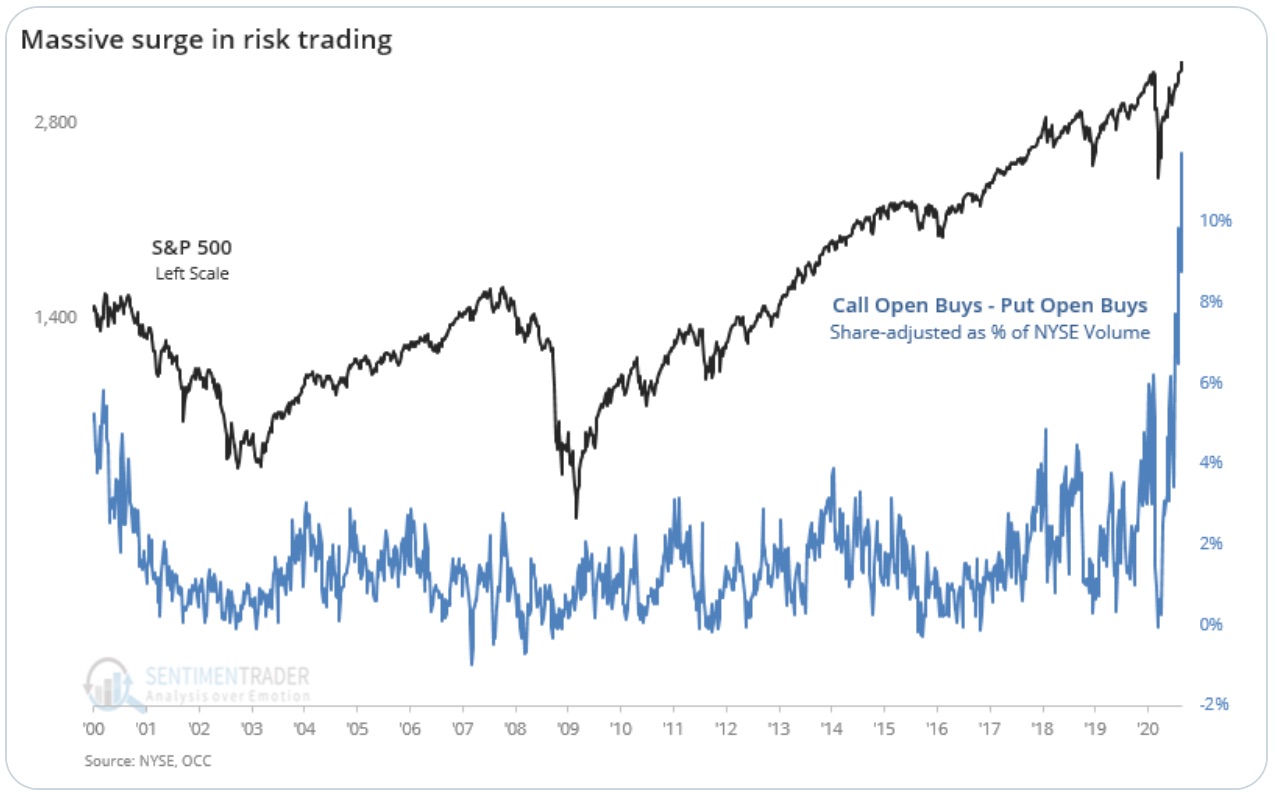
Here are the charts showing current market extreme bullishness


Wednesday, September 2, 2020

NQ Guideline For Thursday

A huge opening gap-up on Wednesday was aggressive sold, with NQ dropping sharply down to critical support, the 200-ma on the 5-minute chart before market manipulators were able to reversed it back up. NQ closed near the high of the day on Wednesday.
 
NQ may continue to trade sideways on Thursday with key support at 12,260 and resistance at Wednesday swing high at 12,440.
 
As long as Wednesday swing low is not clearly violated NQ should remains in sideways trading mode. However, should Wednesday low is clearly broken we could see a big decline. If so the next support level is 12,000-12,050

Tuesday, September 1, 2020

NQ Guideline For Wednesday

Another trending up day for NQ on Tuesday. It is rare to see two trending up days in a row. However, on the daily chart, we can clearly see NQ in parabolic type of up move, as such the patterns is displaying abnormal characteristics.
 
With the US dollar continuing to tank, money rush into stock, pushing the stock prices upward. It is very difficult to forecast when the parabolic move will end as it is driven by emotion. But when it does ends, the reversal is fast and swift.
 
Key inflection price level for NQ on Wednesday will be at 12,260
-- Bullish above, next upside target is a higher high above Tuesday swing high.
-- Bearish below it, with downside target at 12,160
 
NQ daily chart showing it is now in parabolic move up.